Stop guessing auto scaling targets for TTS on Amazon SageMaker AI
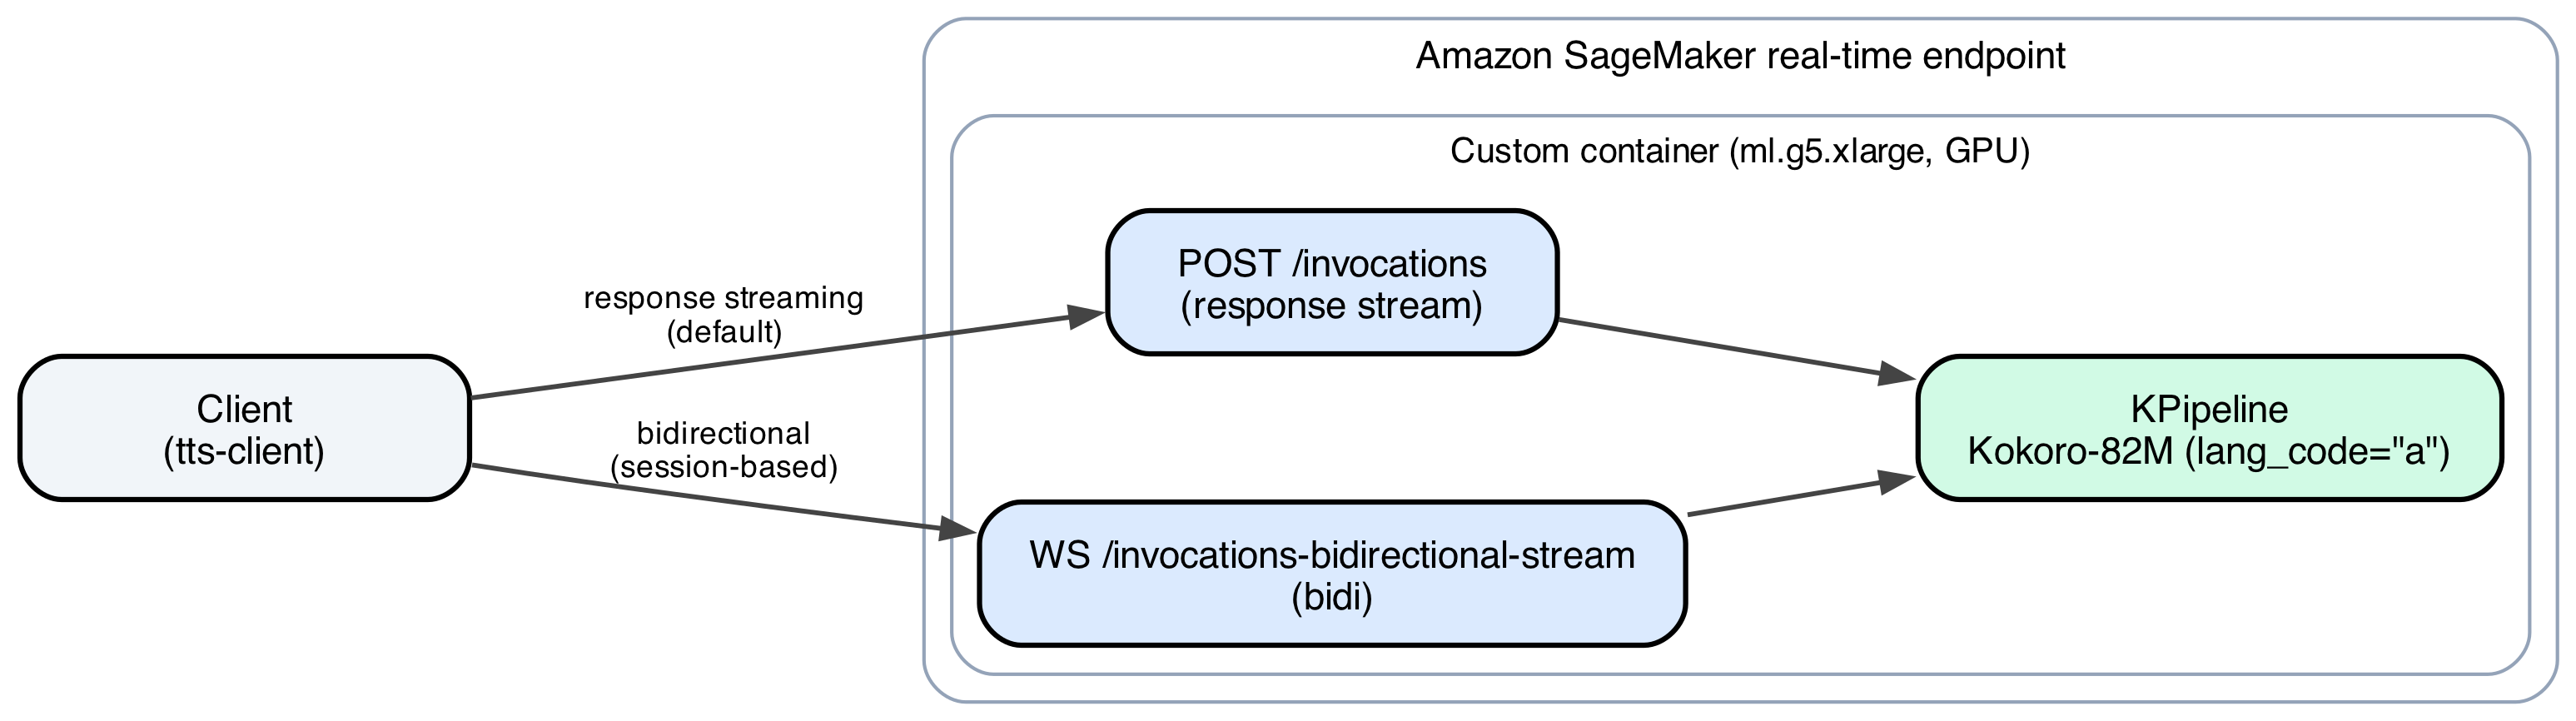
An AWS Machine Learning Blog post walks through deploying Kokoro-82M, an 82-million-parameter text-to-speech model, in a custom container on an Amazon SageMaker AI real-time endpoint, and replacing a guessed auto scaling target with numbers measured against that live endpoint. The approach is packaged as an aws-samples repository with AWS CDK stacks and a command-line tool chain, and every figure in the post comes from one actual deployment and measurement run.
The problem it targets is silent failure. A scaling target that is too conservative leaves GPU instances idle, a cost that shows up on invoices but never as an alarm; a target set too aggressively lets each instance hold more concurrent requests than it can serve inside its latency promise, so nothing looks wrong until a real spike pushes queueing past the service level objective. For this workload the relevant signal is simply how many requests are queued and executing on an instance right now. Kokoro-82M makes that unusually clear: it is non-autoregressive, a StyleTTS2 derivative with an ISTFTNet decoder, producing a full utterance in one duration-aligned pass, so there is no token-generation loop to hang a per-token throughput metric on.
The deployed policy scales on ConcurrentRequestsPerModel, a metric SageMaker AI publishes itself rather than one the container must emit. That removes a class of failures where a custom metric is configured correctly but nothing actually reports to it. One subtlety the tooling handles: the metric publishes a Maximum statistic over a 10-second window, which is not the same as the mean in-flight count a load generator observes. At each rung of the ladder both quantities are recorded and their ratio applied to convert the measured threshold into CloudWatch units. In this run the ratio was 1.0 at every rung, so the two matched directly.
Deployment runs through three CDK stacks in order: one for IAM roles and an S3 bucket caching model weights, one that syncs Hugging Face weights into that bucket once via CodeBuild, and one that builds the image, pushes it to ECR and creates the model, endpoint configuration and endpoint. A single command applies all three. The third stack gates scaling resources behind two conditions: a static flag that is true whenever max_instances exceeds min_instances, and a second independent check that a feasible measurement artifact exists for the model. Without a real measurement, no scaling resources are synthesized — so a guessed configuration cannot reach production quietly.
The container supports response streaming, which returns audio as it is synthesized so playback can start before the utterance finishes, and bidirectional streaming for long-lived sessions. Running a custom container rather than a managed inference toolkit is what allows its own admission limits and the concurrency signal.
Before any paid load run, a drift command performs a read-only reconciliation between deployed scalable targets, policies and alarm states and what the config says should exist. A stopped or cancelled measurement run is the most common source of mismatch, because it can leave auto scaling frozen on a single instance; a thaw command restores the deployed policy.
Q_max is the largest concurrency at which a request still reaches first audio byte within the 3,000 ms p95 SLO. It is found with a closed-loop ladder that holds a fixed concurrency and steps it up until the SLO breaks; a closed loop avoids coordinated omission, where a slowing server makes the client send fewer requests instead of exposing queueing delay. A dry run prints the schedule and time estimate without AWS calls, letting you budget the roughly 36-minute live run. During the live run auto scaling is frozen and capacity pinned to one instance. The ladder results: 65.4 ms p95 at concurrency 1, 286.2 at 5, 568.5 at 10, 1,129.3 at 20, 1,689.8 at 30, 2,245.0 at 40, 2,805.7 at 50, and 3,374.8 at 60, which breached. Q_max is therefore 50, a bracketed ceiling rather than a lower bound. The same run measured uncontended service time at 61.3 ms mean and 66.1 ms p95.
T_total measures wall-clock time from a capacity request to healthy serving traffic, forced directly rather than waiting on the policy's detection logic. The largest stage is instance provisioning plus image pull at 180.8 seconds, 56.5 percent of the total; every stage after the instance appears in logs adds up to roughly 79 seconds. A 60-second allowance is bounded from the policy's alarm evaluation settings rather than measured, giving a planned-against total of 320.2 seconds, which the plan uses to size surge headroom. The post's own reading is that shrinking the image or using warm capacity pools beats application-level tuning for cutting this time.
The plan command touches no AWS services. From the two artifacts, an SLO of 3,000 ms p95 and a surge ratio of 1.25, it computes arithmetic: h = 0.25; scale-out threshold = 0.75 x 50 = 37.5; scale-in threshold = 0.50 x 50 = 25.0. Headroom for the SLO minus measured service time is 2.934 seconds. A peak of 5,000 requests per second and a trough of 10 size the fleet at one to nine ml.g5.xlarge instances, with queue depth capped at 50 by the container's admission gate — beyond that a request is refused immediately with a 503 rather than left to queue past usefulness. Cooldowns are asymmetric on purpose: 30 seconds out, because one extra instance for half a minute is cheap, and 960 seconds in, roughly three times T_total, because removed capacity costs a full scale-out to replace. A FirstChunkLatencyP95 alarm is set at 65 ms.
Two warnings surfaced rather than defects. Holding 37.5 against a ceiling of 50 puts an instance at 97.4 percent utilization the moment a scale-out triggers, leaving little queue-drain headroom. And scale-in from two instances to one lands the survivor exactly at Q_max, inviting flapping; the long cooldown damps but does not remove that, and a floor of three instances would fix it structurally at the cost of idle capacity. Artifact filenames encode instance type and image digest, and mismatched pairs are refused by default, downgradable to a warning. A final validate command compares the deployed policy against the plan, and both measurement files are committed, so the arithmetic can be reproduced without AWS spend.
In practice, this pattern generalizes to any endpoint whose load cannot be expressed as tokens per second: measure a per-instance concurrency ceiling under a closed loop, measure real scale-out latency, and let thresholds and cooldowns follow. The trade-off is operational — the methodology adds a measurement run of tens of minutes per model and image change, and the artifacts bind to a specific instance type and image digest, so any rebuild of the container invalidates prior numbers.
Why it matters: Teams running self-hosted speech or other fixed-latency inference on SageMaker AI are affected, because the choice of scaling target determines both GPU spend and whether latency promises hold under spikes. Developers get a reproducible recipe — closed-loop measurement, published concurrency metric, arithmetic thresholds and a deployment gate — that replaces console guesswork with artifacts they can re-derive and verify. The caveat, as inference from the stated warnings, is that a measured target alone is not enough: the instance-count floor and cooldown design decide whether the policy stays stable when traffic drops.
Based on reporting from the original publisher. Visit the source for full context and later updates.
Publisher excerpt
Teams deploying custom text-to-speech models on Amazon SageMaker AI often guess at autoscaling thresholds, and a wrong guess either wastes GPU spend or breaches a latency SLO. This post deploys Kokoro-82M as a custom container and derives a measured autoscaling policy from two live-endpoint measurements, Q_max and T_total, instead of guesswork.